Build Your Own Git Contributions Visualisation Tool
This challenge is to build your own version of the GitHub contributions graph:
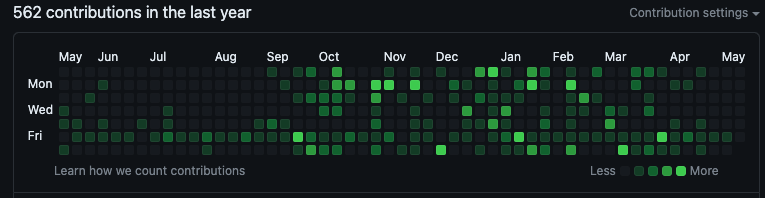
Contribution graphs like this are a great way gamify a task or process. Gamification is a way to motivate an activity by introducing elements of game design into a task. Typically it means things like:
- Awarding points for carrying out tasks.
- Giving badges to mark specific achievements.
- Creating leaderboards that highlight the most frequent contributors.
- Celebrating streaks to reward repeated consistent behaviour.
The approach can be great at helping us keep ourselves motivated to complete ongoing tasks like learning something or sticking to a diet.
I’ve going to use Git contributions for this Coding Challenge because it gives you an easy way to maximise your learning by first completing the build your own git client coding challenge to extract the data from a git repository.
The Challenge - Building A Contributions Visualisation Tool
In this coding challenge you will be building a tool to create a graphical visualisation of the commits made by a user.
Step Zero
Set up your IDE / editor and programming language of choice. You could take this in a few different directions building it as a CLI tool, desktop tool or even as a local analyser that pushes the data to a remote server for rendering on the web. The choice is yours.
Step 1
In this step your goal is to find the git repositories within a directory structure on your local machine. In other words if you have a folder structure like this:
.
|- ccwc
|   |- .git
|- ccsh
|   |- .git
|- ccredis
|   |- .git
|- docs
You should find that the folders ccwc, ccsh and ccredis contain a Git repository but docs does not.
Step 2
In this step your goal is to analyse a repository and determine how many commits there have been in the previous 30 days by the current user.
If you’re a new developer you can probably find a library for your tech stack that can parse a Git Repository and extract the details. If you are more experienced check out the coding challenge that has you building you own Git client and build your own module to parse the repository. It will be a huge additional learning opportunity.
Step 3
In this step your goal is to allow the user to specify a starting location for the search - i.e . to define what the root folder to begin looking for Git repositories is and to allow the user to specify a number of days to go back when generating the visualisation.
Step 4
In this step your goal is to calculate all the stats for each of the repositories. I’d suggest creating a test suite for this step so you can check the logic and ensure that you code correctly gathers the stats for a repo and correctly identifies the contributor
Step 5
In this step your goal is to render the contribution graph for the time period specified. I would suggest making it similar to the GitHub contribution graph, but if you’re feeling creative experiment and see if you can create an interesting alternative.
Going Further
Congratulations for getting this far. If you want to take it further here are some suggestions:
- Allow a per repository graph.
- Generate stats for each contributor.
- Cache the results, so you only need to recalculate for a repo since the last date. Handle edge cases.
Help Others by Sharing Your Solutions!
If you think your solution is an example other developers can learn from please share it, put it on GitHub, GitLab or elsewhere. Then let me know - ping me a message on the Discord Server, via Twitter or LinkedIn or just post about it there and tag me. Alternately please add a link to it in the Coding Challenges Shared Solutions Github repo.
Get The Challenges By Email
If you would like to receive the coding challenges by email, you can subscribe to the weekly newsletter on SubStack here: