Build Your Own Mandelbrot Set Explorer
This challenge is to build your own Mandelbrot set explorer.
The Mandelbrot set is a set of fractals that exhibit great complexity from a relatively simple definition. It’s also used to refer to one particular instance of such a set, which when drawn provides this well known image:
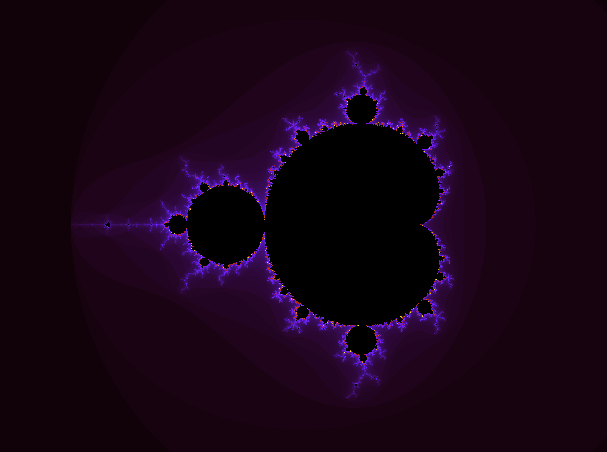
What makes it interesting is the fact that when we zoom in on the set we set the same pattern repeating, in effect the pattern is recursive.
Fort example if I zoom in on the left hand side I get:

Zoom in even more and we start to see the pattern repeating:
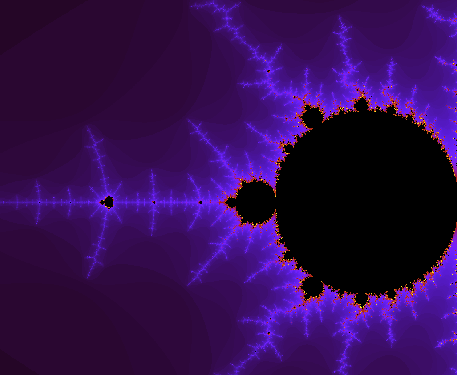
And the more we zoom in, the more we see the same pattern.

The Challenge - Building A Mandelbrot Explorer
In this coding challenge your goal is to build a tool to explore the Mandelbrot set. That is your tool will allow the user to draw the first image above and then zoom in to explore the similarities.
Step Zero
Like all my favourite programming languages, Coding Challenges is zero indexed! In this step your goal is to setup a new project ready to create your Mandelbrot explorer. Now would be a great time to set up a Github/Gitlab repo for the project too, then you can add your shared solution to the Coding Challenges list of shared solutions when you’re done!
Step 1
In this step your goal is to draw the Mandelbrot set. To achieve that draw a plot of the set of complex numbers c for which the function f(z) = z^2 + c does not diverge to infinity when iterated starting at zero. This is explained in more detail on the Wikipedia page for the Mandelbrot set.
Or if you prefer to dig into the math by hand, then wikiHow has an article on how to plot the Mandelbrot set by hand.
Step 2
In this step your goal is to be able to draw a zoomed in view of the set. So instead of drawing the plot for -2.0 to 2.0 on each axis you might draw it from -1.75 to 1.75 or from -1.75 to -1.5.
Step 3
In this step your goal is to allow the user to select which bit of the plot to explore. Either let them select a bounding box on the plot and then use that to re-plot a zoomed in image or let them pick a centre and a magnification, then scale as appropriate.
Step 4
In this step your goal is to allow the user to customise the colours used to plot the set. As you can see below it makes quite a difference.

Step 5
In this step your goal is to export the image as a PNG file. For this step allow the user to specify the size of the produced image and the DPI. This will allow them to create a 72 DPI image for use on a web page (for example) and a 300DPI (or higher) option in they want to create a poster with the image.
Going Further
To take this further dig into and have a play with some of the other fractals.
Help Others by Sharing Your Solutions!
If you think your solution is an example other developers can learn from please share it, put it on GitHub, GitLab or elsewhere. Then let me know - ping me a message on the Discord Server, via Twitter or LinkedIn or just post about it there and tag me. Alternately please add a link to it in the Coding Challenges Shared Solutions Github repo.
Get The Challenges By Email
If you would like to receive the coding challenges by email, you can subscribe to the weekly newsletter on SubStack here: