Build Your Own Network Modelling Tool
This challenge is to build your own network modelling tool.
Several years ago I was the VP Engineering at a VC backed startup that sold network modelling and optimisation tools to global carriers and some of the biggest tech companies in Silicon Valley.
It was one of the best jobs I’ve ever had.
What made it great was the combination of some excellent people and the really interesting problems we got to solve. So interesting and valuable that my name is on several patents as a result of what we did. I got to work with some incredibly smart people who worked at our customers too.
The Challenge - Building A Network Modelling Tool For An IP Network.
For this challenge we’ll build a tool that can load in a network that is described in a CSV file and some traffic data, then we’ll model the traffic flowing over the network to determine the utilisation of each link within the network.
That shows the network designer how close to capacity their network is.
The next most useful thing for many network owners is to be able to see how their network behaves in the event of the worst case failure, so we’ll implement the modelling of that scenario too.
You can build this as a command line tool that outputs another CSV, or you could build a desktop of web based GUI for it. The choice is yours!
An example of a commercial product that does this is Juniper Networks’ NorthStart Planner.
Step Zero
As always the first thing to do is decide on the programming language you’re going to use to tackle this challenge and set up your development environment.
Step 1
In this step your goal is to load a network from file. For simplicity we’ll use a CSV format file - which actually isn’t that uncommon, several of the big carriers we dealt with used Excel to model their networks!
If you imagine the following network:
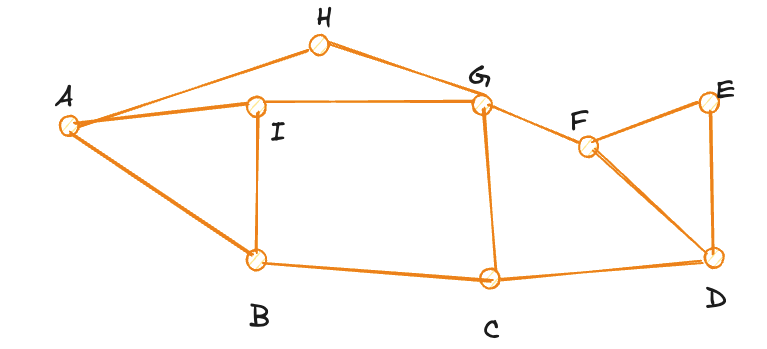
It might be represented like this:
| LinkId | Start | End | Capacity | Weight |
|---|---|---|---|---|
| 1 | A | B | 10 | 5 |
| 2 | B | C | 10 | 5 |
| 3 | C | D | 10 | 5 |
| 4 | D | E | 10 | 5 |
| 5 | E | F | 10 | 5 |
| 6 | G | H | 10 | 5 |
| 7 | H | A | 10 | 5 |
| 8 | A | I | 10 | 5 |
| 9 | B | I | 10 | 1 |
| 10 | C | G | 10 | 5 |
| 11 | D | F | 10 | 1 |
| 12 | I | G | 10 | 5 |
| 13 | F | G | 10 | 3 |
For simplicity, assume each link is bi-directional with symmetrical capacity.
If you’re building a GUI you might like to add an x and y coordinate so you can render it onscreen.
Either way build the code to read a CSV like this and model it in a suitable data structure. As always I encourage you to use TDD when developing this functionality.
Step 2
In this step your goal is to determine paths through a network. Imagine we have network traffic that starts from node A and flows to node D, which route would it take? For this Coding Challenge we’re going to model and IP network using Open Shortest Path First (OSPF). Essentially the traffic will flow through the network using the shortest path.
When we say shortest we usually mean the path with the lowest weight (see the column in the input CSV). Some network planners set the weights relative to the actual distances or latencies of the links so they do reflect the shortest physical path, others adjust the weights to engineer traffic through their network.
You can find the shortest path using an algorithm, such as depth-first or breadth-first search, but a better approach would be to use Dijkstra's algorithm. Though there are other options like the Bellman–Ford algorithm.
If you’re building a GUI, consider showing the path by highlighting the links it uses, if not write some tests to verify your implementation works.
Step 3
In this step your goal is to load traffic data from file. The file will contain data about the traffic that ingresses and egress the network at each node. It’ll look something like this:
| Source | Destination | Demand |
|---|---|---|
| A | E | 1 |
| B | A | 3 |
| I | E | 2 |
| A | G | 5 |
| H | D | 4 |
Create suitable data structures to model these demands and load them in from a CSV.
Step 4
In this step your goal is to apply the traffic flow and model the traffic load on the network. For each traffic demand you should route it along the shortest path and determine how much capacity is used on each link. Then produce a report detailing the route of each traffic and the total demand for each link. A link can go over 100%.
If you’re creating a GUI you might like to colour each link to reflect > 80% and > 100% utilisation. Network designers are keen to avoid this as the network will be fragile if links are heavily utilised and if the utilisation exceeds the capacity traffic will be dropped.
Step 5
In this step your goal is to determine the Worst Case Failure (WCF). This is a useful tool for network designers as it allows them to understand how the network behaves in the event of failures. Ideally they want to ensure just enough capacity (capacity costs money) to ensure that in the case of a failure of a link, no other links exceed capacity.
You can determine the worst case failure for a single link by ‘removing’ the link from the network then applying the traffic demands. The worst case will be the case with the highest number of un-routable traffic demands, then the highest number links over capacity, or if none go over capacity the network with the link that’s closest to reaching capacity.
Going Further
If you want to take this further consider allowing the user to refine the visualisation of the network - moving nodes around. You could even allow them to specify the latitude and longitude of the nodes and render them on a map.
If you’ve not built a GUI you could extend the WCF to handle multiple link failures.
Help Others by Sharing Your Solutions!
If you think your solution is an example other developers can learn from please share it, put it on GitHub, GitLab or elsewhere. Then let me know - ping me a message on the Discord Server, via Twitter or LinkedIn or just post about it there and tag me. Alternately please add a link to it in the Coding Challenges Shared Solutions Github repo.
Get The Challenges By Email
If you would like to receive the coding challenges by email, you can subscribe to the weekly newsletter on SubStack here: